Understanding your Invoice Incompliance
1591875660001
VATConnect Analytics is designed to give you full control, transparency and visibility of your data. Insights, within Analytics, aims to provide you with data about your data. Our Invoice Incompliance report adds a new level of actionable insights, enabling one to forensically analyse what’s driving invoice incompliance. Our goal is that by specifying and quantifying the root causes of invoice incompliance we can enable action and measure the impact of those actions over time.
Here’s a brief video that walks you through Invoice Incompliance or scroll on down to read the detailed guide:
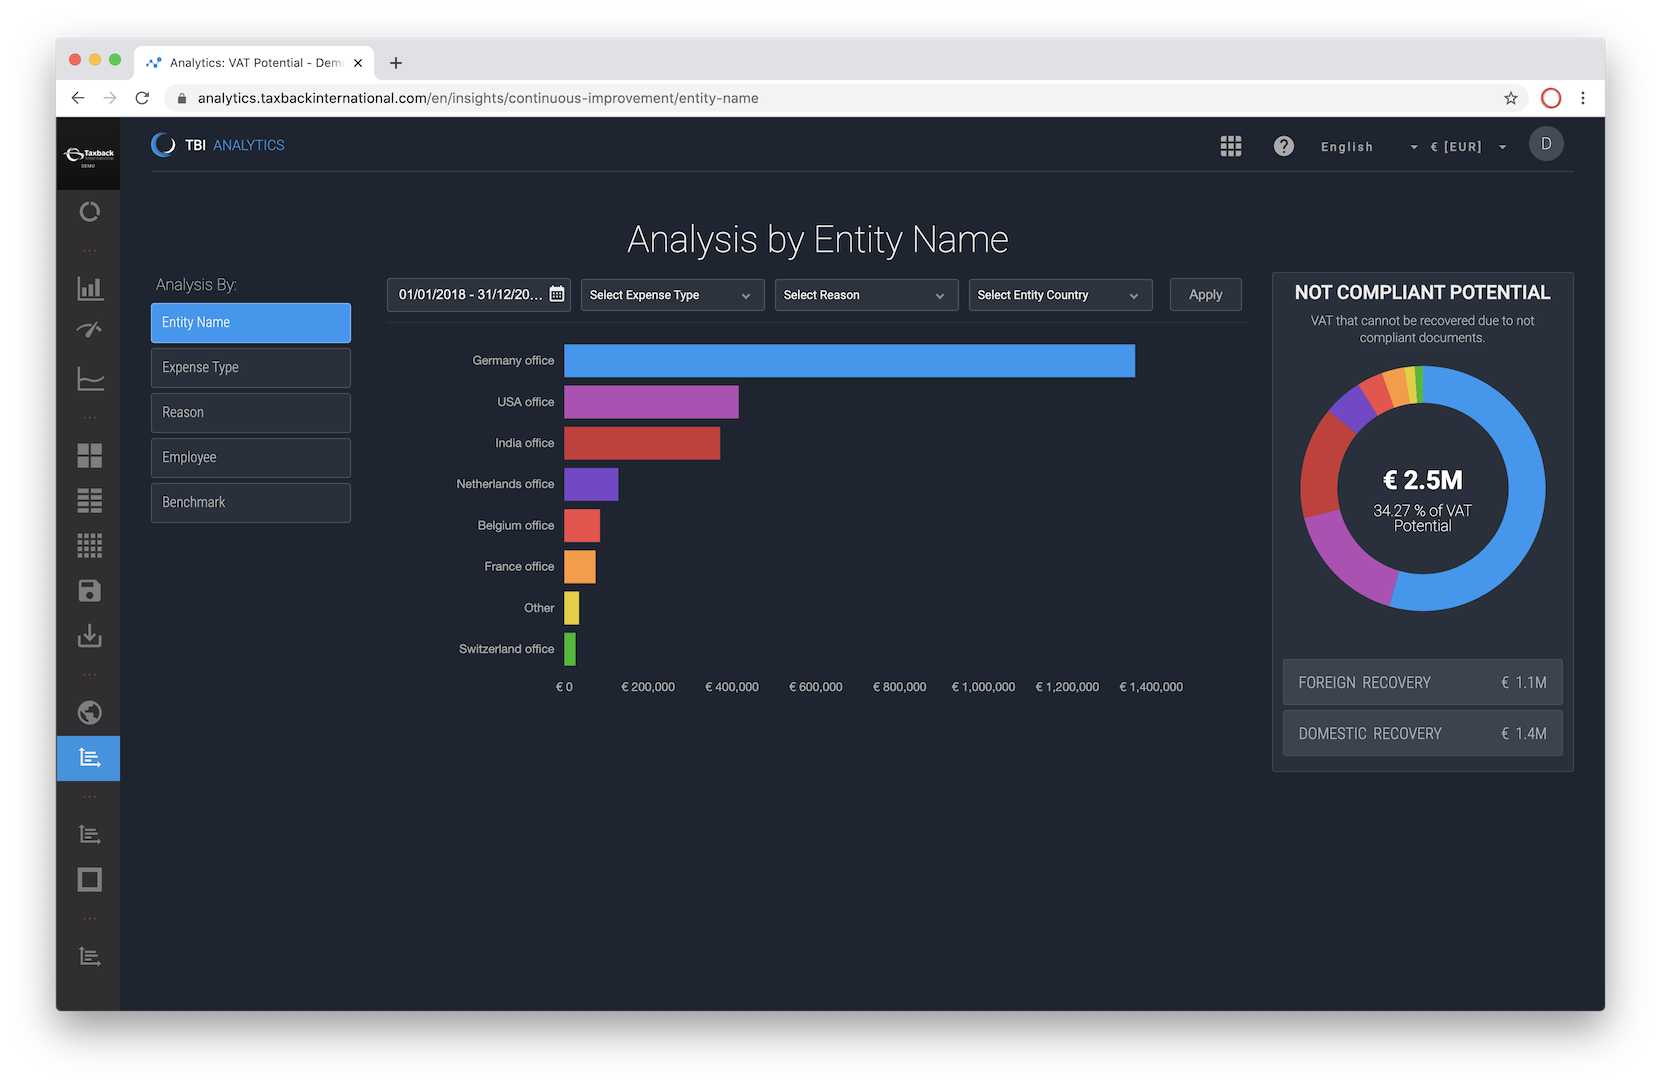
Invoice Incompliance quantifies the amount of VAT, which is potentially reclaimable, but was not compliant (the receipts or invoices attached to the spend didn’t satisfy the criteria required to be considered compliant). We present that incompliant VAT in 3 key sections:
By segment (on the left)
The details of that segment (in the middle)
The overall amount (of incompliant VAT) on the right)

Jumping through each segment allows one to see the invoice incompliance grouped by that segment. For example the 1st segment presents the incompliant VAT by entity. One can refine that view further by applying additional filters across the top.

In the example above, the user has segmented by Reason and the applied 3 additional filters to hone in on a specific root cause:
Expenses approved since the beginning of 2018
Expense that were of expense type Travel
And have originated from any of the entities in Germany

In any of the graphs one can click on the data point to view the transactional breakdown of that incompliant spend.

The Employee section focuses on what % of employees are contributing to what portion of the of incompliant VAT. The graph visualises that distribution, in the example shown one can see that 20% of the employees contribute to nearly 80% of the incompliant VAT. The detailed table below quantifies that impact by employee, specifically reporting on, for each employee:
The entity name and country they’re associated with
The total value of the not compliant VAT
The count of those transactions
The % of the value and the quantity of the not compliant transactions
The overall % contribution of that employee towards ones incompliant VAT
Please note you can choose whether to show an Employee ID or Employee Name for this report.

The Benchmark view is different insofar that it measures the Compliance rate as a percentage over time in 1 or 3 month intervals. If Invoice Incomplaince aims to provide actionable insight into what drives ones incompliance, the Benchmark report measures the impact of those actions by tracking compliance rate over the specified period. There are three data points shown:
The industry compliance average
Your compliant percentage (in orange)
Your correctable percentage (in green)
Correctable is tracked here to predict the % increase if all correctable invoices were to become compliant over time.
On average, Taxback International clients increase their VAT reclaim by 50% versus their previous VAT recovery solution. You can check out the success stories from just a few of our thousands of happy clients around the globe! Contact your account manager or get in touch with us directly to learn how.